Let’s be honest. Car shopping is messy. It’s subjective. You might fall in love with the leather stitching on a 2018 Mazda CX-5, or hate the headlight shape on a Ford Explorer. But there’s one metric that doesn’t care about your taste buds or your aesthetic preferences: NHTSA safety ratings.
Every car sold in the US must meet federal minimums. Most buyers want more than the bare minimum. You can’t know for sure if a car is safe until you’re actually in a crash. That’s terrifying logic. Yet, when you’re signing the papers, you need data. You need to know how those airbags and crumple zones perform when physics takes over.
That’s where the crash tests come in.
Private groups like the Insurance Institute for Highway Safety (IIHS) give ratings, but the National Highway Traffic Safety Administration (NHTSA) is the law. Their scores are mandatory for window stickers. They are the baseline. If a car fails here, it doesn’t get on the road.
Why the NHTSA Matters More Than You Think
The NHTSA doesn’t get much press compared to flashy auto shows, but it runs the show. Established in 1970, the agency’s job is blunt: save lives, prevent injuries, and cut down the $230 billion the economy loses to traffic crashes every year.
Consider that. Crashes are the leading cause of death for Americans across all age groups. The NHTSA handles recalls for vehicles, tires, and even child seats. Without them, manufacturers could slap unsafe metal on the highway. Parents wouldn’t know if their infant seat would hold up. You wouldn’t know if that “new” car is actually a death trap.
Good ratings drive sales. Bad ratings kill them. Dealerships push the models with the gold star. Consumers buy what they trust. The NHTSA sits at the center of that trust. It’s not just a regulator. It’s a gatekeeper.
How NHTSA Safety Ratings Are Determined
The testing isn’t a suggestion. It’s a rigorous, scientific gauntlet. The NHTSA doesn’t just look at the size of the car. They look at how it behaves when the world hits it.
The Frontal Crash Test
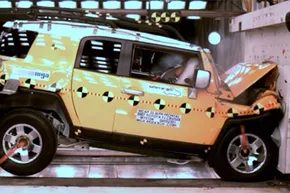
This is the bread and butter. The car drives into a rigid barrier at 35 mph. That’s roughly 56 km/h. It mimics a head-on collision with another vehicle of similar size. Inside the dummy: sensors measure head acceleration, chest compression, and leg injuries.
The goal? Keep the survival cell intact. If the steering column moves forward into the driver’s chest, the score drops. If the airbag deploys too late or too early, points vanish.
The Side Crash Test
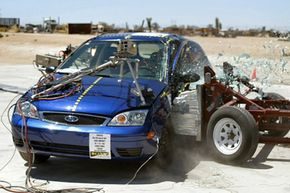
Side impacts are brutal. They offer little crumple zone. The NHTSA uses a moving deformable barrier to simulate a T-bone collision. It hits the driver’s side at 38.5 mph. This test is harsher because there’s less metal between you and the oncoming traffic.
They look at how the door holds up. Does it buckle? Do the side curtain airbags stay inflated long enough? The dummy’s head is the critical metric. If it hits the window frame, the rating suffers.
The Rollover Test
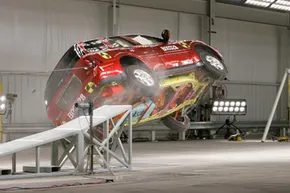
This one is tricky. The car is put on a rotating drum. It’s pushed until it tips. The Dynamic Rollover Resistance test measures the vehicle’s tendency to roll over in a single-truck accident, like swerving to avoid a deer.
The Static Stability Factor (SSF) is calculated. It looks at the track width and center of gravity. SUVs with high centers of gravity often struggle here. A low SSF means a higher risk of flipping if you overcorrect on the highway.
The 5-Star Rating System
The final score is a sum of these tests. It’s not a pass/fail. It’s a star system. One star is the minimum to be legal. Five stars is the goal.
The rating isn’t just for the whole car. It’s broken down:
– Overall Vehicle Score
– Frontal Crash Driver Side
– Frontal Crash Passenger Side
– Side Crash Driver Side
– Side Crash Rear Seat
– Rollover
You can buy a car with a 4-star overall score but a 5-star side crash rating. Context matters.
What Drivers Need to Know About the Window Sticker
When you walk onto a lot, look at the Monroney sticker. The NHTSA rating is front and center. Usually a gold star graphic. But don’t just glance. Read the breakdown.
A high overall rating might hide a weak side crash score. Or a poor rollover resistance. The sticker tells you exactly where the vehicle excels and where it might fail.
For example, if you live in a rural area with lots of deer, the rollover rating is your bible. If you commute in heavy city traffic, the frontal and side crash ratings are more relevant.
The NHTSA data is public. It’s free. You don’t need to pay for a report. It’s on the sticker. It’s in the database. It’s the most objective truth you have in a dealership full of sales pitches.
Beyond the Stars: The Reality of Crash Testing
Crash tests are controlled. Real life isn’t. A 2010 Honda Accord tested in 2010 might perform differently in a 2024 crash due to materials science advancements. But the core principles remain. Crumple
The Limits of the Crash Lab
The government wants you to trust the stars on the window sticker. Dealerships lean on those five stars to justify premium pricing, while buyers use them as a shield against liability. It is a high-stakes game. The NHTSA knows this. That is why the New Car Assessment Program (NCAP) standardizes the violence. They want you comparing apples to apples, even if one apple is crumpled metal and the other is still rolling.
The front barrier test is the big one. A vehicle smashes into a fixed deformable barrier at 35 mph (56.3 km/h). The intent is to simulate a head-on collision between two cars of similar mass and size. Here is the catch that salesmen often skip. The rating predicts performance against a peer. It does not predict survival if you T-bone a semi-truck or get hit by a heavy SUV. If you drive a compact, the NHTSA rating assumes you are hitting another compact. The math changes when the mass disparity widens.
Side-impact tests follow a different script. A moving deformable barrier slams into the driver’s side at 34 mph (54.7 km/h). The test vehicle itself moves forward at 17 mph (27.4 km/h). This simulates the complex physics of a real-world intersection crash. Again, the data holds true for similar-sized vehicles. It tells you how well the B-pillar holds up when struck by a neighbor’s sedan.
Then there is the rollover rating. This is not about occupant protection in a rollover event. It is a stability score. The NHTSA uses dynamic vehicle testing to measure the Static Stability Factor (SSF). They look at the track width and the height of the center of gravity. Wide track plus low center of gravity equals stability. Tall, narrow vehicles like minivans and trucks are inherently more prone to tipping. The test measures the threshold of rollover, not the safety of the cage once it rolls.
Decoding the Star System
The NHTSA breaks down the star ratings by occupant position. It is not a single score for the entire car.
Frontal Barrier Test
– Driver: Rated. The dummy in the driver’s seat takes the hit.
– Front Passenger: Rated. The front passenger side structure is evaluated.
– Rear Passengers: Not rated. The NHTSA assumes rear seats are safer in frontal crashes because they are further from the impact zone. The front seats absorb the primary crash energy.
Side Barrier Test
– Driver: Rated. The impact occurs on the driver’s side door.
– Rear Passenger: Rated. The dummy behind the driver is exposed to the same intrusion forces.
– Front Passenger: Not rated. Since the barrier hits the driver’s side, the front passenger is shielded by the vehicle’s structure and the driver’s position.
The scale is straightforward. One to five stars. Five stars is the best. Three stars is average. Most cars land here. If a vehicle gets a one or two, you have a valid reason to walk away.
Rollover Ratings
This scale is different. It runs from one to four stars.
– Four stars: Low risk.
– One star: High risk.
The number reflects the probability of rollover in a single-vehicle incident. Take the 2010 Chevrolet Tahoe. It holds a three-star rating. The data indicates a 24 percent chance of rollover in a specific evasion scenario. That is not a guarantee it will roll. It is a statistical likelihood based on its geometry.
Where to Find the Data
You do not have to trust a salesman’s word. The database is public. Visit safercar.gov. Search by make, model, and year. The NHTSA updates its list as new vehicles enter the market. The data is raw. It is unpolished. It is exactly what you need to make a decision that does not involve a sales commission.
Improving NHTSA Ratings
Manufacturers do not ignore these scores. They engineer around them. If a model scores poorly in the frontal offset test, the next year’s refresh often reinforces the A-pillars and upgrades the airbag systems. The side barrier test has led to stronger door beams and reinforced B-pillars across the industry. Rollover ratings have pushed engineers to lower centers of gravity, even in SUVs, by lowering the chassis and widening the track.
The cycle is continuous. The NHTSA raises the bar. The manufacturers raise their steel. The consumer gets safer cars, or at least cars that look safer on paper. But the paper only tells half the story. It tells you how the car behaves in a controlled, isolated event. It does not tell you how you drive. It does not tell you about the road conditions or the other drivers. The stars are a starting point. They are not the final word on safety.
“The rating is a snapshot of performance under specific, repeatable conditions. Real-world crashes are rarely so kind.”
Consider the weight difference. A 2,000-pound car getting five stars in a front crash will fare differently against a 5,000-pound truck than against another 2,000-pound car. The energy transfer is the same, but the structural integrity of the larger vehicle may overwhelm the smaller one’s crumple zones. The rating assumes symmetry. Life rarely provides symmetry.
What matters more is how the car protects you when the symmetry breaks. The NHTSA data is a baseline. It is a necessary tool. But it is not the whole picture. You need to look at the IIHS tests too. They use different offsets. They test the driver’s side more aggressively. They look at small overlap crashes that the NHTSA does not currently mandate. The two agencies do not always align. When they disagree, you have to dig deeper.
The industry is shifting. Electric vehicles change the crash dynamics. Battery packs add weight. Torque is instant. The NHTSA is playing catch-up with new protocols for EVs. The ratings you see today may not fully capture the risks of tomorrow’s platform. The data is always lagging slightly behind the technology.
So you check the stars. You check the weight. You check the size. You make your choice. But remember, the crash test is a simulation. It is a proxy for survival. The actual outcome depends on speed, angle, and luck. The stars are just a probability. Not a promise.
Beyond the Government Label: Why the IIHS Matters
NHTSA stars are a solid starting point, but they aren’t the final verdict on vehicle safety. If you’re serious about protecting yourself and your passengers, you need to look past the federal government’s rating system. The Insurance Institute for Highway Safety (IIHS) offers a different, often stricter, perspective that many safety-conscious buyers overlook.
How IIHS Testing Differs From NHTSA Standards
The core difference lies in the test scenarios. NHTSA focuses heavily on frontal and side impacts between similar vehicles. IIHS digs deeper into specific failure points that NHTSA ignores.
For instance, NHTSA does not rate how well a car protects occupants in rear-end collisions. IIHS does. Rear-impact crashes are common in city driving, and whiplash is a serious injury. Ignoring this metric leaves a gap in your safety data.
Rollover safety is another major divergence. NHTSA only calculates the likelihood of a rollover based on a vehicle’s center of gravity. It doesn’t test what happens during the rollover. IIHS performs physical roof-strength tests. A strong roof structure is the only thing keeping the cabin from collapsing when the car rolls. That distinction matters when survival is on the line.
The Small Car vs. Large Car Reality
Both agencies typically crash-test vehicles against identically sized counterparts. This creates a controlled environment, but it doesn’t always reflect real-world traffic.
In 2009, IIHS changed the script. They noticed a trend of extra-small cars sharing the road with mid-sized and full-sized vehicles. So, they crashed the Toyota Yaris, Honda Fit, and smart fortwo into mid-sized cars.
The results were telling. Vehicles that earned high marks when hitting a similarly sized car often performed poorly when struck by a larger vehicle. Mass and momentum dictate crash outcomes. A small car can’t generate enough force to protect its own structure against a heavier SUV, even if the small car is built well. This data is crucial for anyone buying a compact car in a market dominated by larger trucks and SUVs.
Why NHTSA Still Holds Ground
IIHS isn’t flawless, and NHTSA isn’t stagnant. The federal agency constantly refines its tests based on emerging data. The rollover rating, for example, was added specifically because of the exploding SUV market and the high number of associated accidents. Without that rating, consumers would have been flying blind regarding rollover risk.
NHTSA provides a baseline. IIHS provides the nuance.
Making the Call
When you’re shopping, don’t just check the sticker. Look up the IIHS Top Safety Pick ratings. Check the roof strength score. See how the car handled the small-overlap front test.
The NHTSA five-star rating is a good sign. It means the car meets federal minimums. But the IIHS rating tells you how the car behaves when those minimums aren’t enough.
Where do you stop looking? There’s no perfect score. Just more data.